
Introduction
Projects in agricultural and natural resource management, urban planning, and community development typically have a component that involves analysis and mapping of spatial data. Spatial data are often handled within a GIS (Geographical Information System), which is a software platform that stores, analyzes, manages, and visualizes such data. Project related data will often be obtained through specific data collection methods. For example, the location of tagged reptiles or birds can be obtained through GPS enabled smart phones, or the spread of aquatic weeds, such as Crested Floating Heart () can be assessed through remotely sensed imagery from unmanned aerial vehicles in combination with image analysis methods. Besides these project specific data, other data for a project may be readily available in existing data repositories. Examples of such data are land cover maps, which provide a visual representation of the physical and biological materials on the Earth's surface; road data, which can help to model the accessibility of a given location; or citizen-science (CS) based data collections of organisms (birds, snakes, butterflies), such as iNaturalist. This document focuses on two data repositories from which users can download street data at no cost for further processing and analysis. Besides road data, there are also specific data formats that allow public transit agencies to share static and dynamic information about their transportation networks (e.g., travel schedule, fare, locations of stops, arrival predictions) for download (e.g., https://mobilitydatabase.org/) and processing in a GIS. For this purpose, data are typically provided in the General Transit Feed Specification (GTFS) or GTFS-realtime format.
In this document we use the terms street network and road network interchangeably. Road networks describe systems of connected lines and points that facilitate land-bound transportation with different modes. These modes include motorized transportation, such as car or bus, and non-motorized transportation, such as cycling or walking. Streets can be grouped into different hierarchies according to their functions and capacities, including freeways, arterials, collectors, local roads, or bicycle tracks. GIS data are found both as freely accessible datasets and as proprietary datasets from vendors for purchase.
The rapid development of navigation systems in cars and mobile devices, such as smart phones, which use GPS technology for positioning, had a big impact on the demand of accurate digital street network data. Most manufacturers of navigation systems rely on the expertise of commercial street data providers. Commercial street data can also be purchased as a stand-alone product, where the costs vary with spatial extent and complexity of the data. As an alternative resource there exist publicly accessible street datasets that come at no cost to their users.
Freely Available Data Sources of Street Networks
A general distinction of free geodata can be made between authoritative data and volunteered data. The first group of data is managed and distributed by professional organizations and agencies, whereas the second group is collected by volunteers in a collaborative effort. This document will describe datasets from both groups.
TIGER/Line (Topologically Integrated Geographic Encoding and Referencing system) data, provided by the United States Census Bureau, is freely available for download from https://www.census.gov/geographies/mapping-files.html. TIGER/Line data include a wide range of geographic feature types, such as roads, railroads, rivers, and lakes, as well as legal and statistical geographic areas, such as counties, school districts, or census blocks. The TIGER/Line data cover the entire United States. Road features come with various attributes, including address ranges, the geographic relationship to other features, road classification, geometry length, street name, and ZIP code. TIGER/Line data are provided in different formats, such as the shapefile, File Geodatabase, GeoPackages, or KML (Keyhole Markup Language). The Census Bureau releases updates of TIGER/Line data once per year. On their website the user can select a county for downloading TIGER/Line roads. That road data file contains an attribute field called MTFCC (MAF/TIGER Feature Class Code) which specifies the road category. MTFCC categories commonly used for road data include S1100 (Primary Road), S1200 (Secondary Road), S1400 (Local Neighborhood Road, Rural Road, City Street), S1710 (Walkway/Pedestrian Trail), or S1820 (Bike Path or Trail).
A change in the paradigm for the collection of geodata occurred in the mid 2000s in connection with the development of the Web 2.0, which allows Web users to actively participate in contributing and sharing content over the internet. Two of the first widely known Web 2.0 projects, Wikipedia (www.wikipedia.org), and Flickr (www.flickr.com) changed the way people use the internet. The Web community changed from passive consumers of Web content to active participants. The development of smart devices with GPS functionality allows the Web community to interact with each other, provide geo-coded information to central sites, and thus to become a significant source of geographic information. Such voluntary shared spatial data has been coined “Volunteered Geographic Information” (Goodchild, 2007).
The second freely available dataset we describe is based on a project called OpenStreetMap (OSM) (www.openstreetmap.org) which is one of the most prominent Web 2.0 applications that allow contributing and sharing geospatial data. OSM gives all internet users the opportunity to download data without any fees and to use it (under certain licensing conditions) for their own projects. The goal of the OSM project is to create a detailed map of the world with data collected by volunteers. OSM covers a wide range of object types that go beyond road data. Besides many road related features, it also maps amenities (e.g., restaurants, libraries, bicycle rental places); historic landmarks (e.g., archeological sites, castles); physical land features (e.g., beaches, cliffs, glaciers); or railbound features (e.g., tram, subway, and monorail tracks and stations). A comprehensive list of features that are commonly mapped in OSM can be found at https://wiki.openstreetmap.org/wiki/Map_Features. The origin of OSM road network data in the United States goes back to TIGER/Line data, which were imported into the OSM database for the entire United States soon after the OSM project started (Zielstra, Hochmair, and Neis 2013). This initial step allowed volunteers to update, complement, and correct these street data within the OSM platform from then on. Since then, many other data imports, i.e., an upload of external data to OSM, were performed. In addition, corporate edits, which describes OSM data edits through editors that are compensated for their contributions by their employer, usually large tech companies, such as Meta, Apple, Microsoft, or Uber, have nowadays become more common (Sarkar and Anderson 2022). While OSM data can be downloaded directly and used readily in many geospatial applications and analysis tasks, it is also incorporated into other freely available mapping products, such as the Overture Maps transportation theme (https://overturemaps.org/). This road network dataset is built from OSM and further enhanced with data from TomTom and other local and regional authoritative sources.
Small OSM datasets can be downloaded directly from the OpenStreetBrowser Web page (https://www.openstreetbrowser.org/). The site provides an interactive map interface through which users can define an area of interest, select from a wide range of themes such as shopping, sports, or roads, and choose among several download formats, including GeoJSON. The downloaded data can then be further processed in various GIS software packages.
As a second method, data can be downloaded from company Web pages, such as www.geofabrik.de, which provide pre-packaged OSM data worldwide in shapefile format among others. The website divides OSM data into hierarchical regions, i.e., country and state. The downloadable files are updated at least once a week.
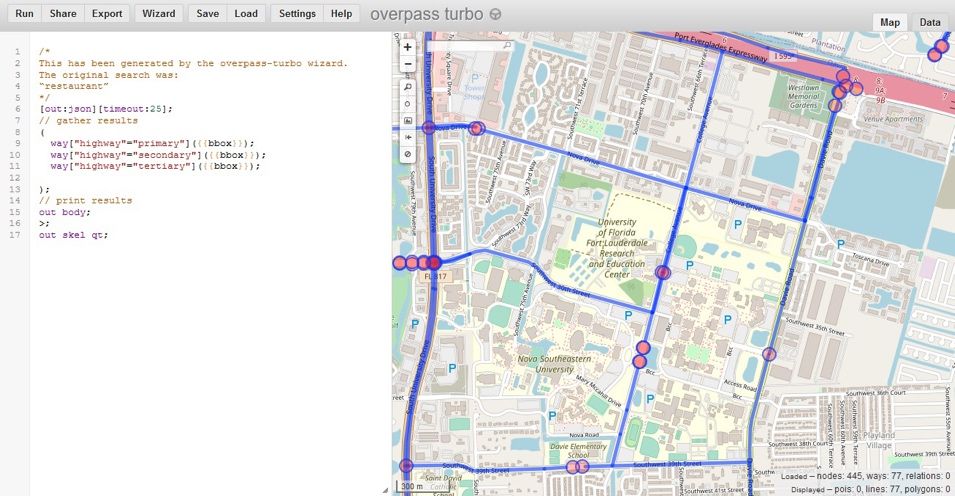
A third method to download specific OSM features for local areas is through the Overpass API (Application Programming Interface) for which an interactive, easy-to-use Web-based frontend (namely the overpass turbo) has been developed. As an example, Figure 1 shows the query used in overpass turbo to retrieve primary, secondary, and tertiary roads from OSM around the UF Fort Lauderdale Research and Education Center (FLREC) in Davie, Florida. In the cartographic visualization, circles with a red filling stand for ways that are too small to be displayed normally. The retrieved data can be exported in various geo-enabled data formats, including GeoJSON, GPX, or KML.
Data Quality
The quality of spatial datasets is crucial for the success of a GIS project. Data quality has several components including attribute accuracy, positional accuracy, logical consistency, completeness, and lineage. Whereas TIGER/Line data are administered by a regulatory instance, i.e., the United States Census Bureau, OSM data are primarily contributed by non-professional individuals with generally little experience or training. Therefore, quality checks are of particular importance for data created in collective mapping and data collection efforts. For OSM there are certain guidelines on how to collect, format, and upload data, but there is no single instance for quality control. It is rather expected that the Web community checks on the correctness of the data, as is being done in comparable projects, such as Wikipedia. The TIGER/Line data are provided through the Census Bureau and have therefore more formal quality control procedures. However, the data are not as frequently updated as OSM data and may therefore omit some recently constructed roads or local features.
In the United States, OSM contributors often focus on network segments that are poorly represented in public road datasets, such as service roads, narrow alleys, and pedestrian paths. As a result, volunteer mapping efforts can make OSM more complete than TIGER/Line data. As an example, Figure 2 maps OSM road data overlaid with TIGER/Line road data (blue) in the vicinity of the FLREC. All roads that do not show in blue are street network data that OSM covers in addition to TIGER/Line data. This map highlights additional OSM footpaths (green), residential roads (brown), and service roads (orange). It clearly illustrates the higher level of detail in OSM road network data compared to TIGER/Line road data. This level of detail in OSM is based on voluntary data collection efforts, which include field surveys, e.g., using GPS data collection devices, or digitizing roads from satellite imagery and aerial photographs. This level of detail renders OSM data useful for pedestrian-related routing applications, such as determining service areas around public transit stations or routing applications for non-motorized traffic.

Further Differences
Completeness is only one of many factors that need to be considered when choosing between OSM and TIGER/Line datasets. Both sources offer a significant amount of information in additional to road geometry.
As opposed to OSM, the TIGER/Line dataset provides addresses and zip code information for most of its segments, which simplifies geocoding. Geocoding is the process of finding associated coordinates, such as latitude and longitude, from other geographic data, such as street addresses. TIGER/Line data provide a more detailed classification of recreational entities (e.g., National Park, State Park, Regional Park), and legal and statistical geographical areas (e.g., census blocks, block groups, tracts, counties, states, urban areas), compared to OSM.
OSM provides a variety of railbound features, such as tram, subway, monorail, and public transit stations, while TIGER/Line only includes railroads. OSM often includes surface and smoothness attributes with their road geometries. This facilitates the development of routing applications that consider the surface type, such as bicycle trip planners for users of road bikes or mountain bikes. Additional information, such as turn restrictions and landmarks, can be useful for routing applications as well.
Sample Applications
This section briefly describes two possible applications of using OSM and TIGER/Line data in GIS projects.
On January 12, 2010, a 7.0 earthquake struck Haiti. The OSM community was able to help the response teams by building a reliable and accurate database of the functional road network and utilities in the affected area. Figure 3 demonstrates how quickly a base map can be built and improved with community-based data collection efforts. It shows two images in the area of Port-au-Prince, Haiti, before (a) and after (b) the earthquake. It is an impressive amount of data that volunteers contributed within days, either from their computers at home or by collecting data in the field using GPS enabled devices. The data include details about the current street network situation (e.g., impassable or blocked streets caused by debris or damage), water and sanitation infrastructure, health and medical facilities, ad hoc settlements and refugee camps.

Credit: Crowley, Erle, & Johnson (2010)
Freely available data generated by volunteers helped during this crisis. With these data first aid forces were able to pinpoint the locations where help was urgently needed and able to identify how to get there. The same type of emergency management could be used in hurricanes, floods, or forest fires where evacuation routes could be developed based on the latest data provided by volunteers.
Hurricanes present substantial challenges to city and county officials in response to hurricane damage and removal of forest debris. In a research study, United States Census Bureau TIGER/Line data were combined with FEMA Project Worksheet reports that itemize vegetation and construction debris amounts and costs of cleanup as well as hurricane damage related to hazard tree pruning and removal (Staudhammer et al., 2009). With this method, researchers revealed that the amount of debris generated depended upon urban forest characteristics, such as landscape-level tree cover, tree density, amount of tree cover in urbanized areas, and the amount of urbanized land.
Conclusions
This document introduced two freely available street network datasets, described their data retrieval process, and pointed out some of their differences. Two sample applications demonstrated the usefulness of free street data in various projects.
Different aspects must be weighed when evaluating the suitability of free datasets for a given project. If a GIS project includes street data, a useful approach is to download and compare TIGER/Line, OSM, and other freely available road network datasets, such as Overture Maps. A sample of a commercial dataset or aerial imagery of the study area can provide an additional basis for comparison, helping to identify potential errors in the road datasets and assess their overall quality.
A final recommendation when using free data is not to rely on a single source, but instead to compare multiple datasets carefully and determine which is best suited to the specific project.
Additional Resources
Crowley, J., Erle, S., and Johnson, J. (2010). Haiti: CrisisMapping the Earthquake. where 2.0 conference, San Jose, CA.
Goodchild, M. F. Citizens as Voluntary Sensors: Spatial Data Infrastructure in the World of Web 2.0 (Editorial) (2007). International Journal of Spatial Data Infrastructures Research (IJSDIR) 2: 24–32.
Flanagin, A. J. and Metzger, M. J. (2008). The credibility of volunteered geographic information. GeoJournal 72: 137–148. https://doi.org/10.1007/s10708-008-9188-y
Haklay, M. (2010). How good is volunteered geographical information? A comparative study of OSM and Ordnance Survey datasets. Environment and Planning B, Planning and Design 37(4): 682–703. https://doi.org/10.1068/b35097
Herfort, B., Lautenbach, S., de Albuquerque, J. P., Anderson, J., and Zipf, A. (2023). A spatio-temporal analysis investigating completeness and inequalities of global urban building data in OpenStreetMap. Nature Communications 14: 3985. https://doi.org/10.1038/s41467-023-39698-6
Juhász, L., Novack, T., Hochmair, H. H., and Qiao, S. (2020). Cartographic Vandalism in the Era of Geo-Gaming: The Case of OpenStreetMap and Pokémon GO. ISPRS International Journal of Geo-Information 9(4): 197. https://doi.org/10.3390/ijgi9040197
Sarkar, D. and Anderson, J. T. (2022). Corporate editors in OpenStreetMap: Investigating co-editing patterns. Transactions in GIS 26: 1879–1897. https://doi.org/10.1111/tgis.12910
Staudhammer, C., Escobedo, F., Luley, C., and Bond, J. (2009). Patterns of urban tree debris from the 2004 and 2005 Florida hurricane season: A technical note. Southern Journal of Applied Forestry 33(4): 193–196. https://doi.org/10.1093/sjaf/33.4.193
Zielstra, D. and Hochmair, H. H. (2011). A Comparative Study of Pedestrian Accessibility to Transit Stations Using Free and Proprietary Network Data. Transportation Research Record: Journal of the Transportation Research Board 2217: 145–152. https://doi.org/10.3141/2217-18
Zielstra, D., Hochmair, H. H., and Neis, P. (2013). Assessing the Effect of Data Imports on the Completeness of OpenStreetMap—A United States Case Study. Transactions in GIS 17(3): 5–334. https://doi.org/10.1111/tgis.12037
Internet
Geofabrik—Provider of preformatted OpenStreetMap Data and OSM-related Tools: https://www.geofabrik.de/
Official Website of the OpenStreetMap Project: https://www.openstreetmap.org/
Overpass turbo: A web-based data mining tool for OpenStreetMap: https://wiki.openstreetmap.org/wiki/Overpass_turbo
MAF/TIGER Feature Class Code (MTFCC) definitions for TIGER/Line data from the US Census Bureau: https://www.census.gov/library/reference/code-lists/mt-feature-class-codes.html
General Transit Feed Specification (GTFS) overview: https://developers.google.com/transit/gtfs