
Purpose and Audience
Soil microbes play important roles in soil health processes, such as nutrient cycling, organic matter decomposition, and aggregate stability. Soil testing labs now include microbial analyses, which often come with unfamiliar terms. This publication aims to educate producers, Extension agents, policymakers, and the public on how to interpret these soil microbial results to better understand their implications for soil health and crop production.
Introduction
Soil provides support for plant growth, and it is a living resource that harbors 100 million to 1 billion microorganisms in 1 gram of soil. Soil microorganisms are living entities, most of which can be seen using a microscope. They include archaea, bacteria, fungi, algae, protozoa, and viruses. Soil microbes are important for maintaining soil health, enhancing plant growth, and supporting sustainable agriculture. They contribute to nutrient cycling, soil organic matter decomposition, and biocontrol of plant pathogens. Some microbes, such as rhizobia (nitrogen-fixing bacteria) and mycorrhizal fungi, also establish beneficial relationships with plants.
In the past, scientists could only study soil microbes by growing them in the lab. With new technologies and methods, scientists can now study many, but not all, types of soil microorganisms, whether they can be grown in the lab or not. They use techniques such as phospholipid fatty acid (PLFA), polymerase chain reaction (PCR), and Next Generation Sequencing (NGS) that look at structural constituents like the fatty acid of membranes and the genetic materials (deoxyribonucleic acid [DNA] and ribonucleic acid [RNA]) of these microbes to understand their identity, distributions, and functions over time and space (Moore-Kucera and Dick 2008; Fierer et al. 2005; Walters et al. 2015; Liao et al. 2019). Using these techniques (PLFA, PCR, and NGS) helps us understand what and where these microbes are, what they do in different environments, and how they interact with one another. Furthermore, we can determine how agricultural practices affect soil microbes.
Many emerging soil health companies and researchers leverage these techniques to identify and quantify soil microbes, which serve as soil health indicators. Microbial data are often included in the soil health reports provided by these companies (Figures 1A & B). The reports include information about general microbial groups such as bacteria and fungi, specific taxa such as Actinobacteria and Ascomycota, and their diversity. Interpreting these microbial data is essential for scientists and stakeholders. This publication intends to help the non-scientific communities understand what these data signify and recognize the common limitations of currently employed analysis tools.
Metrics Used in Soil Microbial Studies
There are different metrics used in scientific research to interpret soil microbial data generated using the PLFA, PCR, and NGS techniques, including microbial diversity, community composition, and species interactions using network analysis (Cassol et al. 2025; Lozupone and Knight 2008; Lozupone et al. 2007; Guseva et al. 2022; Kers and Saccenti 2022; Erhunmwunse, Mackowiak, et al. 2023). To address the knowledge gap in soil microbial investigations, it is important for the public to learn about these metrics, know how to interpret them, and recognize their limits. This publication focuses on metrics that are commonly used in scientific papers and commercial soil testing reports to interpret soil microbiological data.
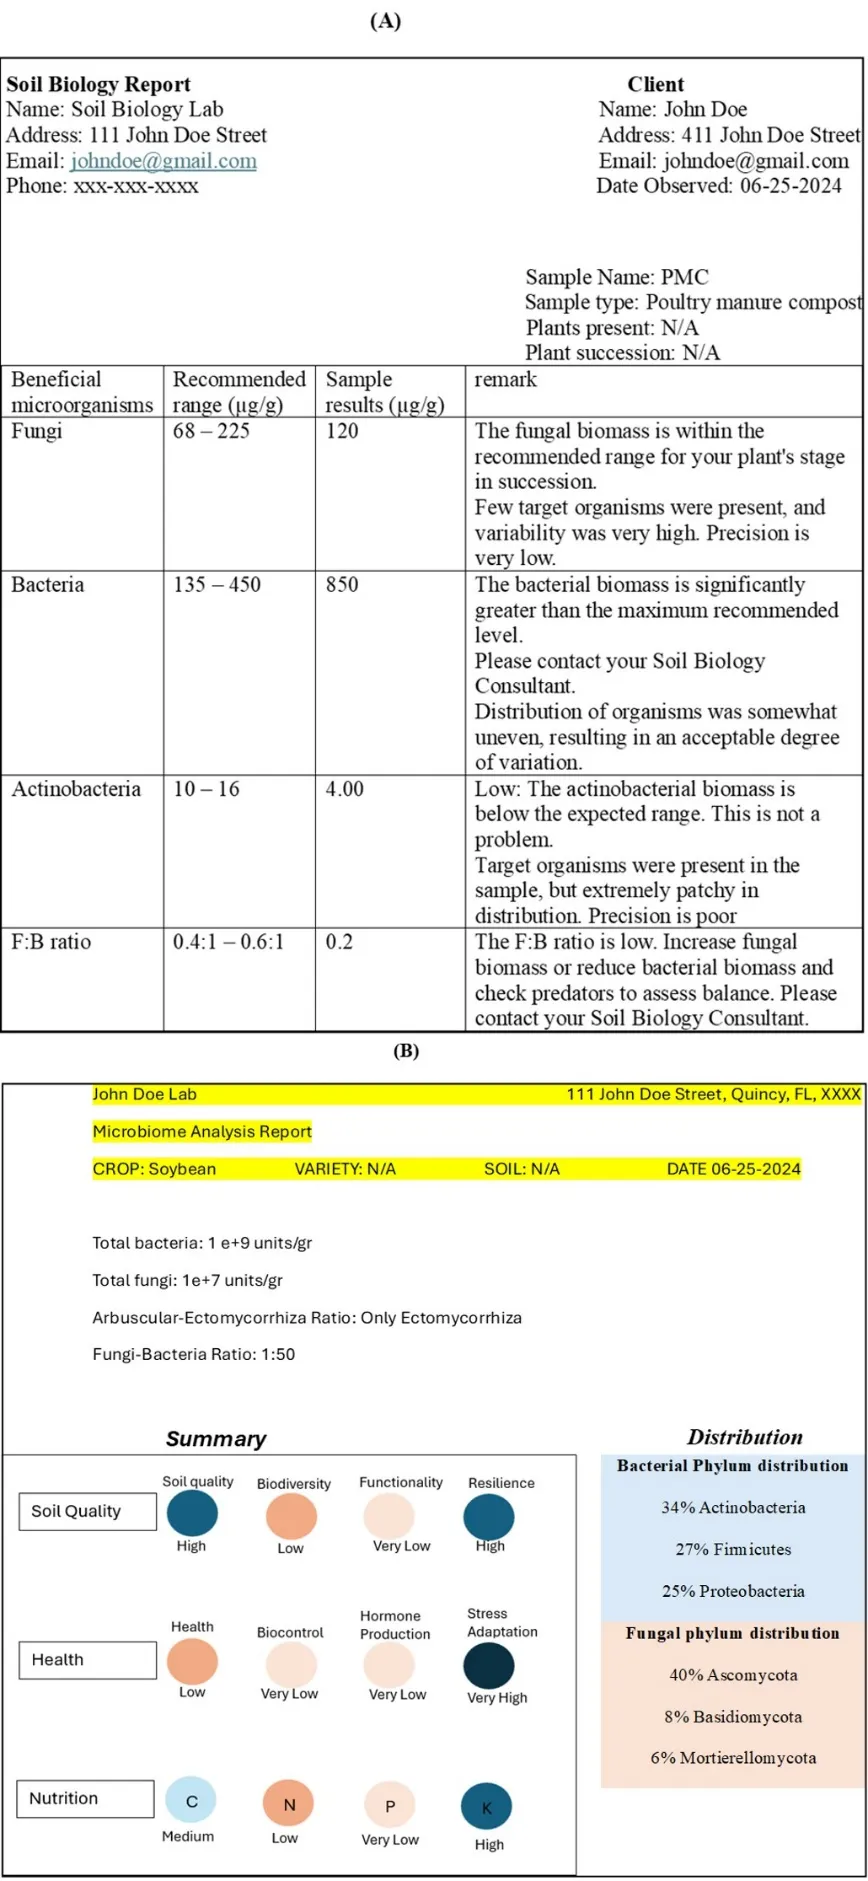
Credit: H.-L. Liao and A. S. Erhunmwunse, UF/IFAS
Microbial Diversity
Soil microbial diversity is mainly assessed by alpha and beta diversity. Diverse soil microbes enhance ecological processes that promote soil health, while low microbial diversity reduces soils' ability to provide key ecosystem functions (Wertz et al. 2006; Le Roux et al. 2011).
Alpha Diversity
Alpha diversity is the diversity within a particular ecosystem or soil sample. It is mainly measured by microbial richness and evenness. Richness represents the number of different microbial species present in soil, while evenness defines their distribution and relative abundance (Figure 2A–D) (Cassol et al. 2025; Lozupone and Knight 2008; Kers and Saccenti 2022). For example, Scenarios A and B both consist of six microbes across three different microbial species, so they have the same richness level. However, Scenario A is dominated by one common microbial species, while Scenario B has an even spread of the three microbial species. Therefore, Scenario B has greater microbial evenness than Scenario A (Figure 2). To demonstrate further, both Scenarios B and D show an even distribution among all microbial species, but Scenario D with eight microbial species is richer than Scenario B with three microbial species. Some indices that measure microbial richness include operating taxonomic units (OTU), Chao1, and abundance-based coverage estimator (ACE) (Cassol et al. 2025; Lozupone and Knight 2008; Kers and Saccenti 2022). Other indices that assess evenness include Simpson’s evenness and Pielou’s evenness, while certain approaches consider both richness and evenness, such as the Shannon index (Cassol et al. 2025; Lozupone and Knight 2008; Kers and Saccenti 2022).
In this section, we used our own studies as an example to explain alpha diversity. This study was conducted at the UF/IFAS North Florida Research and Education Center in Quincy, Florida (Figure 3). We were interested in soil microbial response after rhizoma perennial peanut (Arachis glabrata Benth.) was integrated into a bahiagrass (Paspalum notatum Flugge) system long-term (eight years). We applied the NGS approach targeting bacterial 16S rRNA for soils collected from 0–15 cm depth to identify the alpha diversity of soil bacteria. As shown in Figure 3, we found that bahiagrass soil with rhizoma perennial peanut had greater bacterial alpha diversity (measured by Shannon index and OTU richness) by 36% compared to bahiagrass without rhizoma perennial peanut. This result showed that the presence of rhizoma perennial peanut increased the richness and evenness of bacterial species in the bahiagrass system (Erhunmwunse, Guerra, et al. 2023). Unlike soil and plant nutrient interpretation for agronomic crops, soil microbial testing is still in its early stages and lacks standardized benchmarks or threshold values to determine whether microbial diversity is low or high. Interpreting microbial diversity data can be relative, context-dependent, and not necessarily applicable across diverse agricultural settings.

Credit: A. S. Erhunmwunse, UF/IFAS

Credit: Data adapted from Erhunmwunse, Guerra, et al. (2023)
Beta Diversity
Beta diversity, unlike alpha diversity, is often based on the number of shared microbial taxa between different samples or locations within a given agricultural community or ecosystem. It gives a fair estimate of how similar or different communities are in terms of microbes present. It can be used to assess the influence of a new management practice or disturbance on the microbial community composition of any system. There are different ways to measure beta diversity, and the metric used by scientists depends on their research questions. Bray-Curtis dissimilarity looks at how many different types of microbes are present in each group and how similar or different they are in terms of numbers (Lozupone et al. 2007; Kers and Saccenti 2022). Jaccard similarity looks at whether certain types of microbes are present or not in each group, regardless of how many there are (Lozupone et al. 2007; Kers and Saccenti 2022). UniFrac distance considers how closely related the microbes are to each other evolutionarily, like looking at their family tree (Lozupone et al. 2007; Kers and Saccenti 2022).
Beta diversity is often visualized using ordination plots, such as in principal coordinate analysis (PCoA), derived from a beta diversity metric (Figure 4). Ordination plots are maps that help scientists understand how soil microbial communities change under different management practices or environmental conditions. In an ordination plot, each point represents a sample, such as soil from different fields. Samples that are closer together on the plot have more similar microbial communities, while samples that are farther apart have more different communities. For example, using NGS targeting bacterial 16S rRNA and fungal ITS of our soil samples (0–30 cm) collected from a field trial, we investigated the impact of long-term conversion from a conventional peanut-cotton-cotton rotation to a sod-based bahiagrass-bahiagrass-peanut-cotton rotation on soil microbial communities at different developmental stages (pre-planting, flowering, and maturity) of annual peanut. We found that the sod-based rotation significantly altered soil microbial community composition compared to the conventional rotation across these stages (Figure 4) (Zhang et al. 2022).
Neither alpha nor beta diversity provide information on changes in the abundance of any microbial species, but they do allow us to examine the compositional differences of soil microbes. In the examples given (Figures 3 and 4), the shift in soil microbial diversity and community composition in response to management practices provides insight into how management practices influence the soil microbial community. However, it remains unclear which specific microbial taxa or functional groups have replaced the original ones under the new agricultural management practice. Integration of this information with the identification of community composition or shifted taxa (see the Community Composition section) is necessary to identify microbes that play an important role in enhancing soil health.

Credit: Data adapted from Zhang et al. (2022)
Community Composition
Like any living organism, microbes can be grouped into classification systems such as kingdom, phylum, class, order, family, genus, and species. This classification can help us identify different microbial taxa; understand their genetic, metabolic, and ecological traits; and determine their potential functions within the given ecosystem. Recognizing well-studied microbial groups in the soil, such as arbuscular mycorrhizal fungi, biological nitrogen-fixing bacteria, and plant growth-promoting microbes (e.g., Mortierella elongata), can assess the potential capacity of soil to support crop nutrient uptake and soil carbon, nitrogen, and phosphorus processes through the activities of these dominant microbial groups (Table 1) (Erhunmwunse, Mackowiak, et al. 2023; Erhunmwunse, Guerra, et al. 2023; Erhunmwunse, Queiroz, et al. 2023).
Furthermore, newer microbial taxa are now recognized as performing ecological functions previously thought to be carried out by specific microbes. For example, only bacteria were thought to be responsible for nitrification, but uncultured archaea have also been found to be involved in this process. Information on microbial community composition provides a clearer picture of the microbial community's organization and how it may be influenced by environmental factors.
Some commercial soil microbial labs now include microbial taxa at specific levels (e.g., Actinobacteria, Firmicutes, and Proteobacteria) (Figure 4B) in their reports, depending on the objectives and application of the report. Others focus on broad microbial groups like fungi (Figure 4A), which decompose organic materials and enhance soil structure, and bacteria, the largest soil microbial group.
We conducted different studies across north, central, and southwest Florida to determine the benefits of integrating rhizoma perennial peanut into bahiagrass pastures on soil microbial communities and their potential impacts on soil health and plant growth. We applied the DNA-based NGS approach on the soils collected from 0–15 cm depth to identify the relative abundance of bacterial and fungal taxa at different levels such as phylum, order, class, and genus. In our study, we found bacterial genera (Bacillus, Bradyrhizobium, and Streptomyces) and fungal genera (Trichoderma, Glomus, and Mortierella; Table 1) to be dominant microbes in our bahiagrass-rhizoma perennial peanut systems (Erhunmwunse, Queiroz, et al. 2023). Among those genera, Bradyrhizobium is known for converting atmospheric nitrogen into forms that plants can use. Furthermore, Glomus is a well-known arbuscular mycorrhizal fungus that mobilizes phosphorus and nitrogen for plant uptake. We also observed that the relative abundance of some of the dominant microbial genera was higher in the bahiagrass-rhizoma perennial peanut mix compared to the monoculture of bahiagrass. Together, this information suggests that integrating legumes into grass pastures may improve soil health and plant growth by enhancing potential beneficial soil microbes.
However, the DNA-based NGS approach captures active and inactive microbial communities, making it difficult to determine which functions are actively occurring in agricultural systems since functions are predicted from identified microbial taxa rather than expressed genes. This method also provides only relative abundances, not absolute abundances, so caution must be taken when interpreting these results. An increase in relative abundance does not necessarily mean an increase in microbial growth, unless absolute abundance is quantified alongside the sequencing data (Harrison et al. 2021). Furthermore, the use of metagenomics (the study of the genetic material of all microbial communities in a sample) and metatranscriptomics (an RNA-based method for assessing gene expression levels in a microbial community, which is beyond the scope of this publication) can identify the composition of microbial communities, expressed genes, and active microbial functions (Terrón-Camero et al. 2022). Overall, identifying the relative abundance of microbial taxa remains important for understanding soil community diversity, structure, and recurring patterns under different environmental conditions, which help in making inferences about ecological functions.
Table 1. The dominant bacteria and fungi genera in rhizoma perennial peanut-based bahiagrass pastures and their roles in promoting plant growth and soil health (Data adapted from Erhunmwunse, Mackowiak, et al. 2023; Erhunmwunse, Guerra, et al. 2023; Erhunmwunse, Queiroz, et al. 2023).
Network Analysis
Microbial network analysis is gaining attention in several soil microbiology publications (Guseva et al. 2022). Commercial soil testing reports do not currently include these types of indicators, but this analysis could become more standardized in the future. Microbial network analysis is like mapping a social network for microbes. Just as people interact with each other, microbes interact with other microbes by sharing or competing for space and resources. Network analysis is used to study these interactions within similar (bacteria-to-bacteria) and across different (bacteria-to-fungi) microbial kingdoms. To visualize microbial networks, we collect data about which microbes are present in a sample and how they interact with each other. Then, we create a map or network showing these interactions. Nodes represent each microbe species, and lines (edges) show how they are connected to one another (Figure 5). By studying these networks, we can learn a lot about how microbes influence each other and their environment. For example, we might find that certain microbes are important because they are connected to many others, like popular influencers in a social network. From these networks, we can discover microbes that work together to build soil health and help plants grow or deprive others of their resources. These microbe-to-microbe interactions, whether positive or negative, play a major role in how communities of soil microbes together carry out their functions.
However, network analysis has important limitations because it depends on the quality of data used. All challenges associated with DNA-based NGS still apply when these data are used to build microbial networks, including the inability to distinguish between active and inactive microbes. In addition, rare microbial taxa, which may play important roles in ecosystem processes, are often removed during network construction because they can produce false or misleading associations. Despite these limitations, studying interactions among soil microorganisms remains useful for understanding patterns that influence soil health, nutrient cycling, and plant production, while soil microbiologists continue to improve methods to address these limitations.

Credit: Zhang et al. (2022, Figure 5D)
Challenges and Limitations of Soil Microbial Data and Recommendations
Soil microbes play important roles in soil, but measuring and interpreting soil microbial data are challenging. Soil microbial tests are still in their early stages, hence there are no recognized thresholds for interpreting whether high or low microbial diversity or the abundance of individual microbial taxa are beneficial or not. Soil microorganisms can vary across different locations within a field due to differences in topography, texture, and organic matter, making it difficult to collect representative samples that reflect overall soil health. Furthermore, microbes respond to crops, soil types, farming practices, weather conditions, and growth stages, all of which complicate interpretation. To account for this variability, samples should be collected consistently from small, well-defined areas of a field (Zuber and Kladivko 2018).
Some biological labs use PLFA testing to measure soil microbes, while others use DNA-based markers (Moore-Kucera and Dick 2008; Fierer et al. 2005; Walters et al. 2015; Zuber and Kladivko 2018). Results can vary between labs due to differences in methods. It is important that farmers remain consistent with the same lab and ensure their methods remain unchanged.
While DNA sequencing has gotten less expensive, it still requires specialized equipment, experience, and interpretation, which may not be available to all farmers. To address these problems, DNA-based approaches should be integrated with other soil health indicators, as well as appropriate sample and interpretation guidelines for agricultural applications.
Take Home Messages
- Soil microbes directly regulate soil nutrient processes and crop nutrient uptake, making them valuable biological indicators of soil health.
- PCR and DNA-based NGS approaches targeting bacterial 16S rRNA and fungal ITS are commonly used by scientists and soil testing companies to generate soil biological indicator reports for assessing soil health.
- The data generated from PLFA, PCR, and DNA-based NGS can be used to estimate microbial diversity, identify dominant and new taxa, and quantify their relative abundances.
- Microbial diversity can be used to assess shifts in microbial communities in response to agricultural practices and environmental conditions.
- We can identify dominant microbial taxa and uncover uncultured soil microbial taxa that promote plant growth and critical ecological processes.
- Soil microbial tests are still in their early stages. Therefore, there are no established benchmarks to determine the optimal or suboptimal levels of microbial diversity or abundance of individual microbial taxa.
- Interpretation of data from soil testing reports must be done cautiously, considering the limitations of these techniques.
- Advances in metagenomics and metatranscriptomics, particularly improvements that make these methods more cost- and time-effective for high-throughput applications, should help overcome the limitations of the 16S rRNA and fungal ITS approaches. These methods can provide information on the direct functions of these microbes, such as specific nutrient cycling processes.
Glossary of Terms
- Abundance-Based Coverage Estimator (ACE) index: A metric that calculates microbial richness by emphasizing species that occur with low frequency in a sample.
- Bray-Curtis dissimilarity: A metric that compares the composition of microbial communities by measuring the differences in both the types and abundances of microbes between two groups or samples.
- Chao1 index: An estimator of species richness that accounts for rare or unseen species.
- DNA-based markers: Genetic tools used to identify and quantify soil organisms by analyzing their DNA.
- evenness: A measure of how evenly microbial species are distributed within a community.
- Jaccard similarity: A measure that evaluates the presence or absence of specific microbial species between two groups, without considering their abundance.
- metagenomics: The study of the genetic material of all microbial communities in a sample.
- metatranscriptomics: An RNA-based method for assessing gene expression levels in a microbial community.
- microbial biomass: The total mass of microorganisms (such as bacteria and fungi) present in the soil.
- operating taxonomic units: A method for grouping closely related microorganisms based on sequence similarity.
- phospholipid fatty acid: Structural molecules found in the membranes of active organisms, used in soil microbial tests to estimate the size and composition of microbial biomass.
- phylogenetic relationships: The evolutionary connections among microorganisms, often visualized as a family tree, used to interpret relatedness.
- Pielou’s evenness: An index that assesses the evenness of microbial species distributions, calculated as the observed diversity relative to the maximum possible diversity.
- relative abundance: The abundance of microbial species relative to other species in a sample or system.
- richness: A metric that measures the total number of distinct microbial species or groups present in a soil sample.
- Shannon index: A diversity metric that considers both richness (number of species) and evenness (distribution of species).
- Simpson’s evenness: A metric derived from Simpson’s diversity index that quantifies the uniformity of species abundances in a community.
- UniFrac distance: A metric that assesses microbial community differences based on their evolutionary relationships, incorporating phylogenetic information to evaluate how closely related the microbes are.
References
Cassol, I., M. Ibañez, and J. P. Bustamante. 2025. “Key Features and Guidelines for the Application of Microbial Alpha Diversity Metrics.” Scientific Reports 15: 622. https://doi.org/10.1038/s41598-024-77864-y
Erhunmwunse, A. S., V. A. Guerra, J. C. Liu, et al. 2023. “Soil Bacterial Diversity Responds to Long-Term Establishment of Perennial Legumes in Warm-Season Grassland at Two Soil Depths.” Microorganisms 11 (12): 3002. https://doi.org/10.3390/microorganisms11123002
Erhunmwunse, A. S., C. L. Mackowiak, A. R. Blount, J. C. Dubeux, Jr., A. Ogram, and H.-L. Liao. 2023. “Short-Term Perennial Peanut Integration into Bahiagrass System Influence on Soil Microbial-Mediated Nitrogen Cycling Activities and Microbial Co-Occurrence Networks.” European Journal of Soil Biology 119: 103566. https://doi.org/10.1016/j.ejsobi.2023.103566
Erhunmwunse, A. S., L. M. D. Queiroz, K. Zhang, et al. 2023. “Changes in Soil Microbial Diversity and Community Composition Across Bahiagrass and Rhizoma Peanut Pastures.” Biology and Fertility of Soils 59: 1–16. https://doi.org/10.1007/s00374-023-01701-z
Fierer, N., J. A. Jackson, R. Vilgalys, and R. B. Jackson. 2005. “Assessment of Soil Microbial Community Structure by Use of Taxon-Specific Quantitative PCR Assays.” Applied and Environmental Microbiology 71 (7): 4117–4120. https://doi.org/10.1128/AEM.71.7.4117-4120.2005
Guseva, K., S. Darcy, E. Simon, L. V. Alteio, A. Montesinos-Navarro, and C. Kaiser. 2022. “From Diversity to Complexity: Microbial Networks in Soils.” Soil Biology and Biochemistry 169: 108604. https://doi.org/10.1016/j.soilbio.2022.108604
Harrison, J. G., W. John Calder, B. Shuman, and C. Alex Buerkle. 2021. “The Quest for Absolute Abundance: The Use of Internal Standards for DNA‐Based Community Ecology.” Molecular Ecology Resources 21 (1): 30–43. https://doi.org/10.1111/1755-0998.13247
Kers, J. G., and E. Saccenti. 2022. “The Power of Microbiome Studies: Some Considerations on Which Alpha and Beta Metrics to Use and How to Report Results.” Frontiers in Microbiology 12: 796025. https://doi.org/10.3389/fmicb.2021.796025
Le Roux, X., S. Recous, and E. Attard. 2011. “Soil Microbial Diversity in Grasslands and Its Importance for Grassland Functioning and Services.” In Grassland Productivity and Ecosystem Services, edited by G. Lemaire, J. Hodgson, and A. Chabbi. CAB International. https://doi.org/10.1079/9781845938093.0158
Liao, H. L., G. Bonito, J. A. Rojas, et al. 2019. “Fungal Endophytes of Populus trichocarpa Alter Host Phenotype, Gene Expression, and Rhizobiome Composition.” Molecular Plant-Microbe Interactions 32 (7): 853–864. https://doi.org/10.1094/MPMI-05-18-0133-R
Lozupone, C. A., M. Hamady, S. T. Kelley, and R. Knight. 2007. “Quantitative and Qualitative β Diversity Measures Lead to Different Insights into Factors that Structure Microbial Communities.” Applied and Environmental Microbiology 73 (5): 1576–1585. https://doi.org/10.1128/AEM.01996-06
Lozupone, C. A., and R. Knight. 2008. “Species Divergence and the Measurement of Microbial Diversity.” FEMS Microbiology Reviews 32 (4): 557–578. https://doi.org/10.1111/j.1574-6976.2008.00111.x
Moore-Kucera, J., and R. P. Dick. 2008. “PLFA Profiling of Microbial Community Structure and Seasonal Shifts in Soils of a Douglas-Fir Chronosequence.” Microbial Ecology 55: 500–511. https://doi.org/10.1007/s00248-007-9295-1
Terrón-Camero, L. C., F. Gordillo-González, E. Salas-Espejo, and E. Andrés-León. 2022. “Comparison of Metagenomics and Metatranscriptomics Tools: A Guide to Making the Right Choice.” Genes 13 (12): 2280. https://doi.org/10.3390/genes13122280
Walters, W., E. R. Hyde, D. Berg-Lyons, et al. 2015. “Improved Bacterial 16S rRNA Gene (V4 and V4-5) and Fungal Internal Transcribed Spacer Marker Gene Primers for Microbial Community Surveys.” mSystems 1 (1): e00009-15. https://doi.org/10.1128/mSystems.00009-15
Wertz, S., V. Degrange, J. Prosser, et al. 2006. “Maintenance of Soil Functioning Following Erosion of Microbial Diversity.” Environmental Microbiology 8 (12): 2162–2169. https://doi.org/10.1111/j.1462-2920.2006.01098.x
Zhang, K., G. Maltais-Landry, S. George, et al. 2022. “Long-Term Sod-Based Rotation Promotes Beneficial Root Microbiomes and Increases Crop Productivity.” Biology and Fertility of Soils 58: 403–419. https://doi.org/10.1007/s00374-022-01626-z
Zuber, S., and E. Kladivko. 2018. Indiana Soil and Water: How to Understand and Interpret Soil Health Tests. AY-366-W. Purdue Extension.